New to working with Gantt charts? This How to Guide will help you understand the basics of our Inspire Planner Gantt chart and how to best use it for your project. Let's get started!
After you have set up your project and written out Tasks, Duration, Start, Finish and Predecessors, your Gantt chart should look similar to the image below. The yellow diamond indicates the beginning of the project.
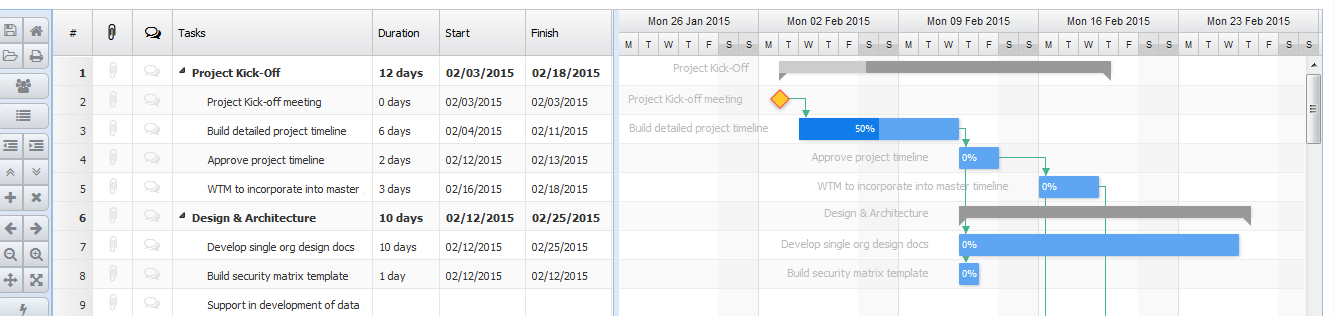
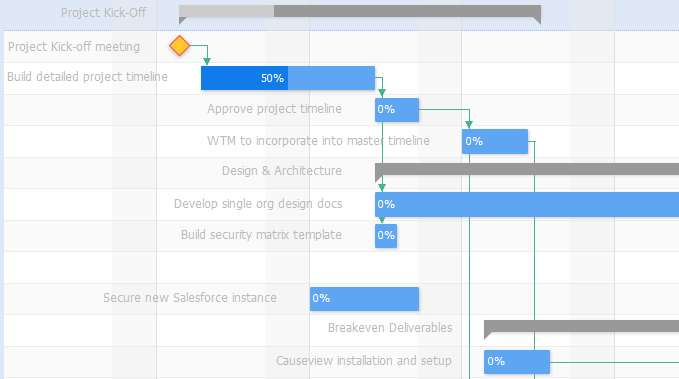
The grey bars indicate the time span that the task and subtasks will cover. It also offers a high level view of amount of completion of these tasks indicated by the light grey section highlighted within the grey bar. When all subtasks are 100% complete the entire bar will be light grey.
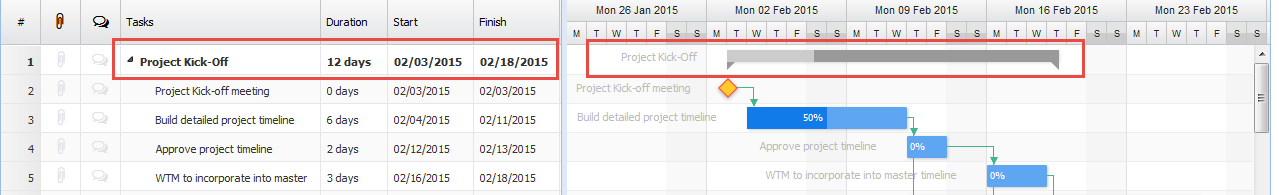
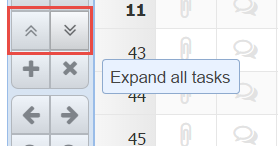
Clicking on the grey bar will collapse all substasks tasks.
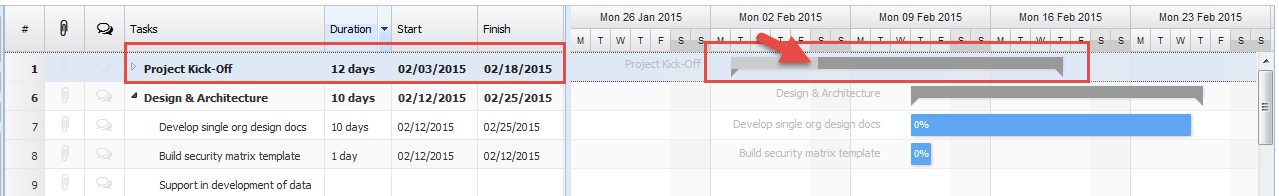
You can also click on the Collapse and Expand icons in the menu on the right hand side of the screen.
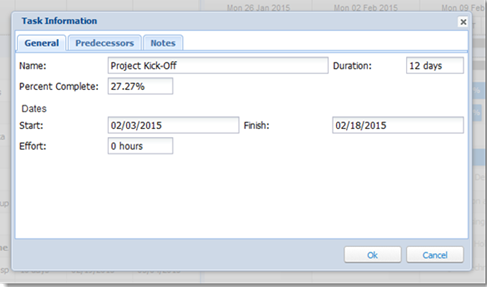
To see Task Information double dlick on the bar associated with the task you would like to see. A pop up window will appear with general information, predecessors and notes. From this window you may change any information, press Ok to save, and then you must press the Save icon in the main project window for all changes to be captured. 
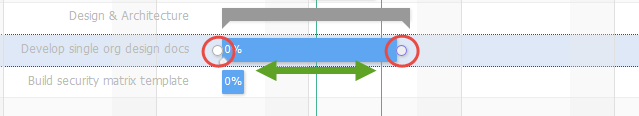
The blue bars are tasks that stand alone, or are subtasks for the summary task (the grey bars). These bars show you the timespan that they cover and the percentage complete that has been acheived. From these bars you are able to change the percentage complete. Place your cursor over where the dark blue meets the light blue and drag until you have the desired around. You may also change the percentage complete within the Project Task area as well.
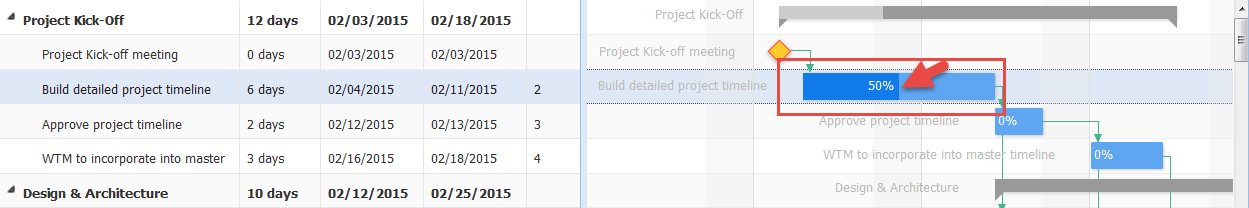
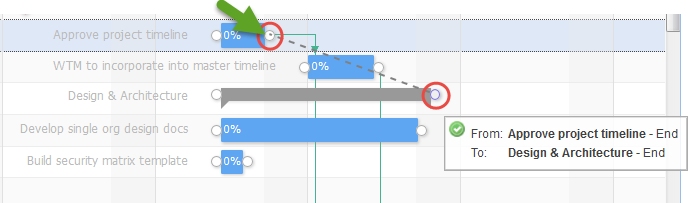
When viewing the Gantt Chart you able to see the task name that the bar is associated to, and the dependencies of the tasks indiated through the green line connecting the bars.
To change how tasks are connected place your cursor over the bar and a white dot will appear. Click on this white dog and drag it to the corresponding white dot of the task you wish to be connected to either at the beginning or end of the bar depending on the project's demands.
To change the duration of the task, click on the white dot of either end of the desired task and drag to correct time frame.
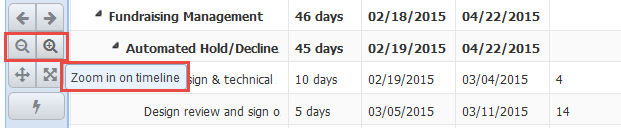
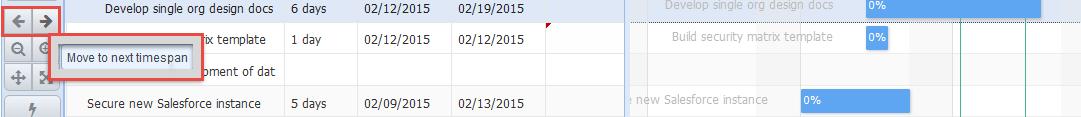
To change the timespan that you are vieiwng, click on the corresponding arrows to either view a previous timepsan or one more in advance.
To change the zoom of the Gantt chart, click on either the zoom in or zoom out button until you have desired outcome.